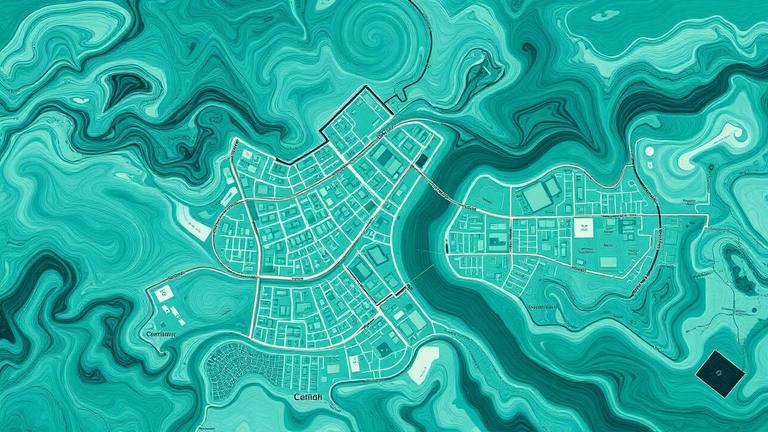

Optimising logistics with geospatial intelligence
Route optimisation, network design and delivery windows: how geospatial data cuts kilometres, cost and emissions in logistics operations.
Logistics is geography with a deadline. Every cost driver in the operation, from fuel to driver hours to failed deliveries, is a function of where things are and how long it takes to move between them. Geospatial intelligence attacks all three at once.
Three levels of optimisation
- Route optimisation (daily). Sequence stops with realistic drive times, time windows and vehicle constraints instead of straight-line distance.
- Territory and fleet design (quarterly). Balance workload across regions so no driver structurally runs over hours.
- Network design (yearly). Decide where hubs, cross-docks and micro-hubs belong, based on demand density and access restrictions.
The data that makes the difference
| Layer | What it fixes |
|---|---|
| Historic speed profiles per road and hour | Planning that matches reality instead of optimistic ETAs |
| Address quality and rooftop geocoding | Failed deliveries and drivers circling a block |
| Access restrictions and zero-emission zones | Fines and unusable routes for the wrong vehicle |
| Loading and unloading times per location type | Underestimated stop times that break the schedule |
| Demand density per postcode over time | Hub locations and capacity planning |
Typical results
In most operations the first gains come from data hygiene rather than clever algorithms. Correcting geocodes, using real speed profiles and measuring true stop times routinely takes 8-15% out of the planned kilometres before any route engine is retuned. Network redesign adds more, but only once the daily data is trustworthy.
Emissions reporting comes for free
The same spatial model that plans the route produces defensible emission figures per shipment, per customer and per zone. With CSRD reporting requirements tightening, that turns an operational tool into a compliance asset.
Frequently asked questions
What is route optimisation?
Route optimisation determines the best sequence and assignment of stops across vehicles, taking drive times, time windows, capacity and legal driving hours into account.
How much can be saved?
Depending on the starting point, 8-15% fewer kilometres is a realistic first step, with further gains from territory and network redesign.
Do we need to replace our TMS?
Usually not. Most gains come from improving the geospatial data feeding the system you already have.
Working with Liplyn
We audit your location data, rebuild the spatial model behind your planning and quantify the kilometres, hours and emissions you can remove.
Continue reading: geospatial analysis in practice
- How geodata prevents grid congestion with smarter charging profiles
- Household and lifestyle segmentation with geodata for the energy transition
- Optimising spatial planning and site selection with geodata
- Greening the inner city and reducing heat stress with geospatial analysis
Related data services
Want to be found in Google and AI search?
We make your brand visible in ChatGPT, Perplexity, Gemini and Google with GEO and SEO.
Explore AI SearchFrequently Asked Questions
Have questions about this topic? Here are the most frequently asked questions.