

Optimising spatial planning with geodata
How geospatial analysis shortens planning decisions: site selection, capacity checks and scenario modelling under the Dutch Omgevingswet.
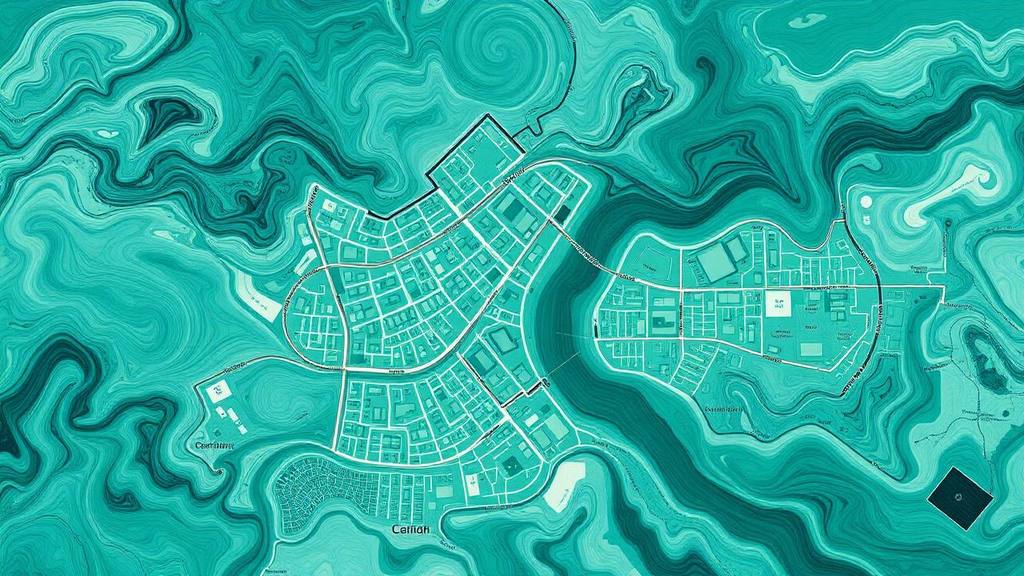
Spatial planning has become an optimisation problem with too many constraints: housing targets, nitrogen, grid capacity, water storage, mobility and heritage all compete for the same square metres. Geodata does not resolve the political choice, but it makes the trade-off visible and defensible.
Where geodata changes the process
- Site selection. Score every candidate location against dozens of layers at once instead of comparing three shortlisted options.
- Capacity checks. Test housing programmes against grid capacity, schools, water and road capacity before the plan is drafted.
- Scenario modelling. Compare densification versus expansion with the same evidence base.
- Participation. A map is understood by residents; a policy annex is not.

A practical layer stack
| Theme | Typical layers | Decision it informs |
|---|---|---|
| Land and ownership | Cadastral parcels, ownership, land value | Feasibility and acquisition cost |
| Environment | Noise, air quality, nitrogen, external safety | Permit risk |
| Water and soil | Elevation, subsidence, water storage, flood risk | Long-term viability |
| Energy | Grid capacity, heat sources, solar and wind potential | Phasing |
| Mobility | Public transport, cycling, road load | Density and parking norms |
From analysis to a defensible plan
The strength of a geospatial approach is reproducibility. Every score is traceable to a source and a weighting, so when a council or an objector asks why location B scored higher than location A, the answer is a documented calculation rather than a professional opinion. That shortens procedures and reduces the risk of a plan being overturned.

Common mistakes
- Too many layers, no weighting. A model with forty equal criteria says nothing.
- Outdated sources. Grid capacity and nitrogen data change quarterly.
- No sensitivity analysis. If the ranking flips when one weight moves 5%, it is not a conclusion.
- Maps without a narrative. Decision-makers need three options, not a data portal.
Frequently asked questions
How does geodata support spatial planning?
It combines land, environment, water, energy and mobility data into one comparable score per location, so options can be ranked transparently.
Which sources are used in the Netherlands?
Mostly public registers such as the Kadaster, BAG, PDOK, AHN elevation data, environmental datasets and grid operator capacity maps.
Does this replace the planner?
No. It removes the manual data work so planners can spend their time on design and negotiation.
Working with Liplyn
We build the evidence base, the weighting model and the maps, and we make sure the result survives scrutiny in the council chamber.
Continue reading: geospatial analysis in practice
- How geodata prevents grid congestion with smarter charging profiles
- Household and lifestyle segmentation with geodata for the energy transition
- Greening the inner city and reducing heat stress with geospatial analysis
- Optimising routes and logistics networks with geospatial intelligence
Related data services
Want to be found in Google and AI search?
We make your brand visible in ChatGPT, Perplexity, Gemini and Google with GEO and SEO.
Explore AI SearchFrequently Asked Questions
Have questions about this topic? Here are the most frequently asked questions.